Table of Contents
Where Insight Shapes Experience
Design is often viewed as the realm of imagination, aesthetics, and intuition. But in today’s most effective digital environments, creativity does not stand alone—it is informed, validated, and refined by data. When we talk about data-driven design, we’re describing an approach that places measurable insight at the center of the creative process. It’s not about replacing intuition with numbers. It’s about enhancing it.
Whether you’re designing an app, a website, or a system of interfaces, data offers more than performance reports—it offers direction. It reveals how users behave, what they prefer, what they ignore, and where they struggle. In a landscape defined by continuous iteration, data-driven design turns assumptions into hypotheses and pushes design from guesswork into precision.
From Opinions to Outcomes
Every design decision implies a belief—about users, their goals, and the best way to meet them. In traditional workflows, these beliefs may stem from experience or creative vision. But without validation, they remain speculative.
Data-driven design offers a path forward by grounding these ideas in observable behavior. Through analytics, user testing, heatmaps, and behavioral metrics, we can understand not only what users are doing, but why. This allows teams to refine experiences based on how they are used in the real world—not how we expect them to be.
Designers still imagine. Still experiment. But they do so with tools that allow them to learn and evolve quickly. The result? Interfaces that are not only beautiful but demonstrably effective.
Data as Feedback Loop
Good design isn’t a one-time event. It’s a continuous feedback loop. You release something into the world, measure its impact, learn from the results, and refine.
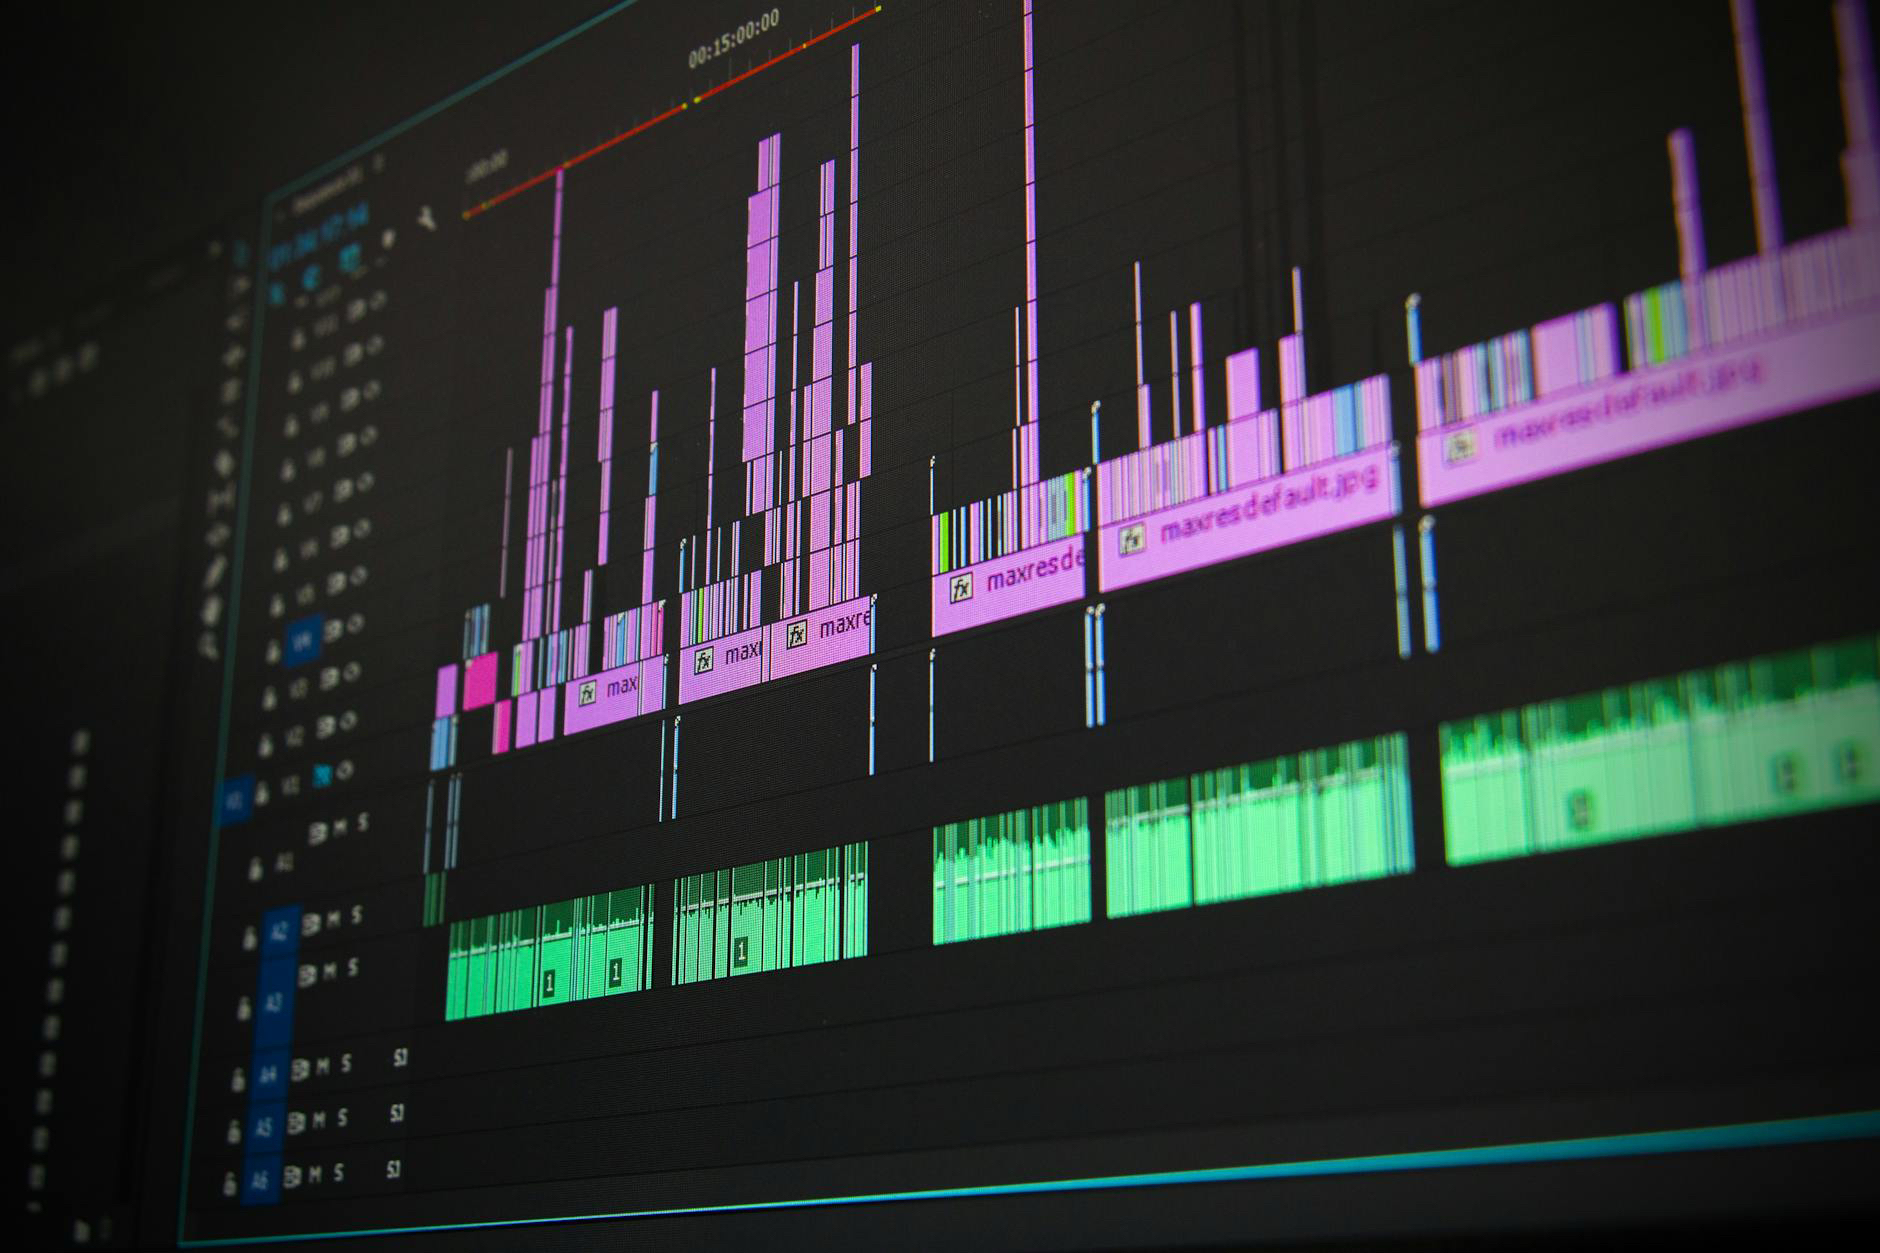
This cycle can include behavioral data from analytics platforms that track page views, conversion rates, and user journeys. It involves user feedback gathered through structured interviews, surveys, or informal conversations. Performance metrics, such as loading times and drop-off points, highlight technical barriers to usability. Tools like heatmaps and session recordings reveal how users interact with the interface at a micro level. Accessibility-focused data, including screen reader behavior or keyboard navigation flows, sheds light on inclusion gaps.
Together, these inputs form a live, evolving picture of the design’s success—and where it falls short.
Qualitative + Quantitative = Full Picture
There’s a common misconception that data equals numbers—and only numbers. But the most effective data-driven design blends quantitative evidence with qualitative insights.
Quantitative data tells you what happened. For example, a spike in bounce rate, or a sudden drop in conversions. These are measurable events. But they don’t explain the cause. That’s where qualitative insight comes in. Through user interviews, usability testing, and open-ended feedback, we learn why users behave the way they do.
Blending both forms of insight is essential. One without the other leads to incomplete conclusions. Together, they offer the depth required to design solutions that truly resonate.
Tools of the Trade
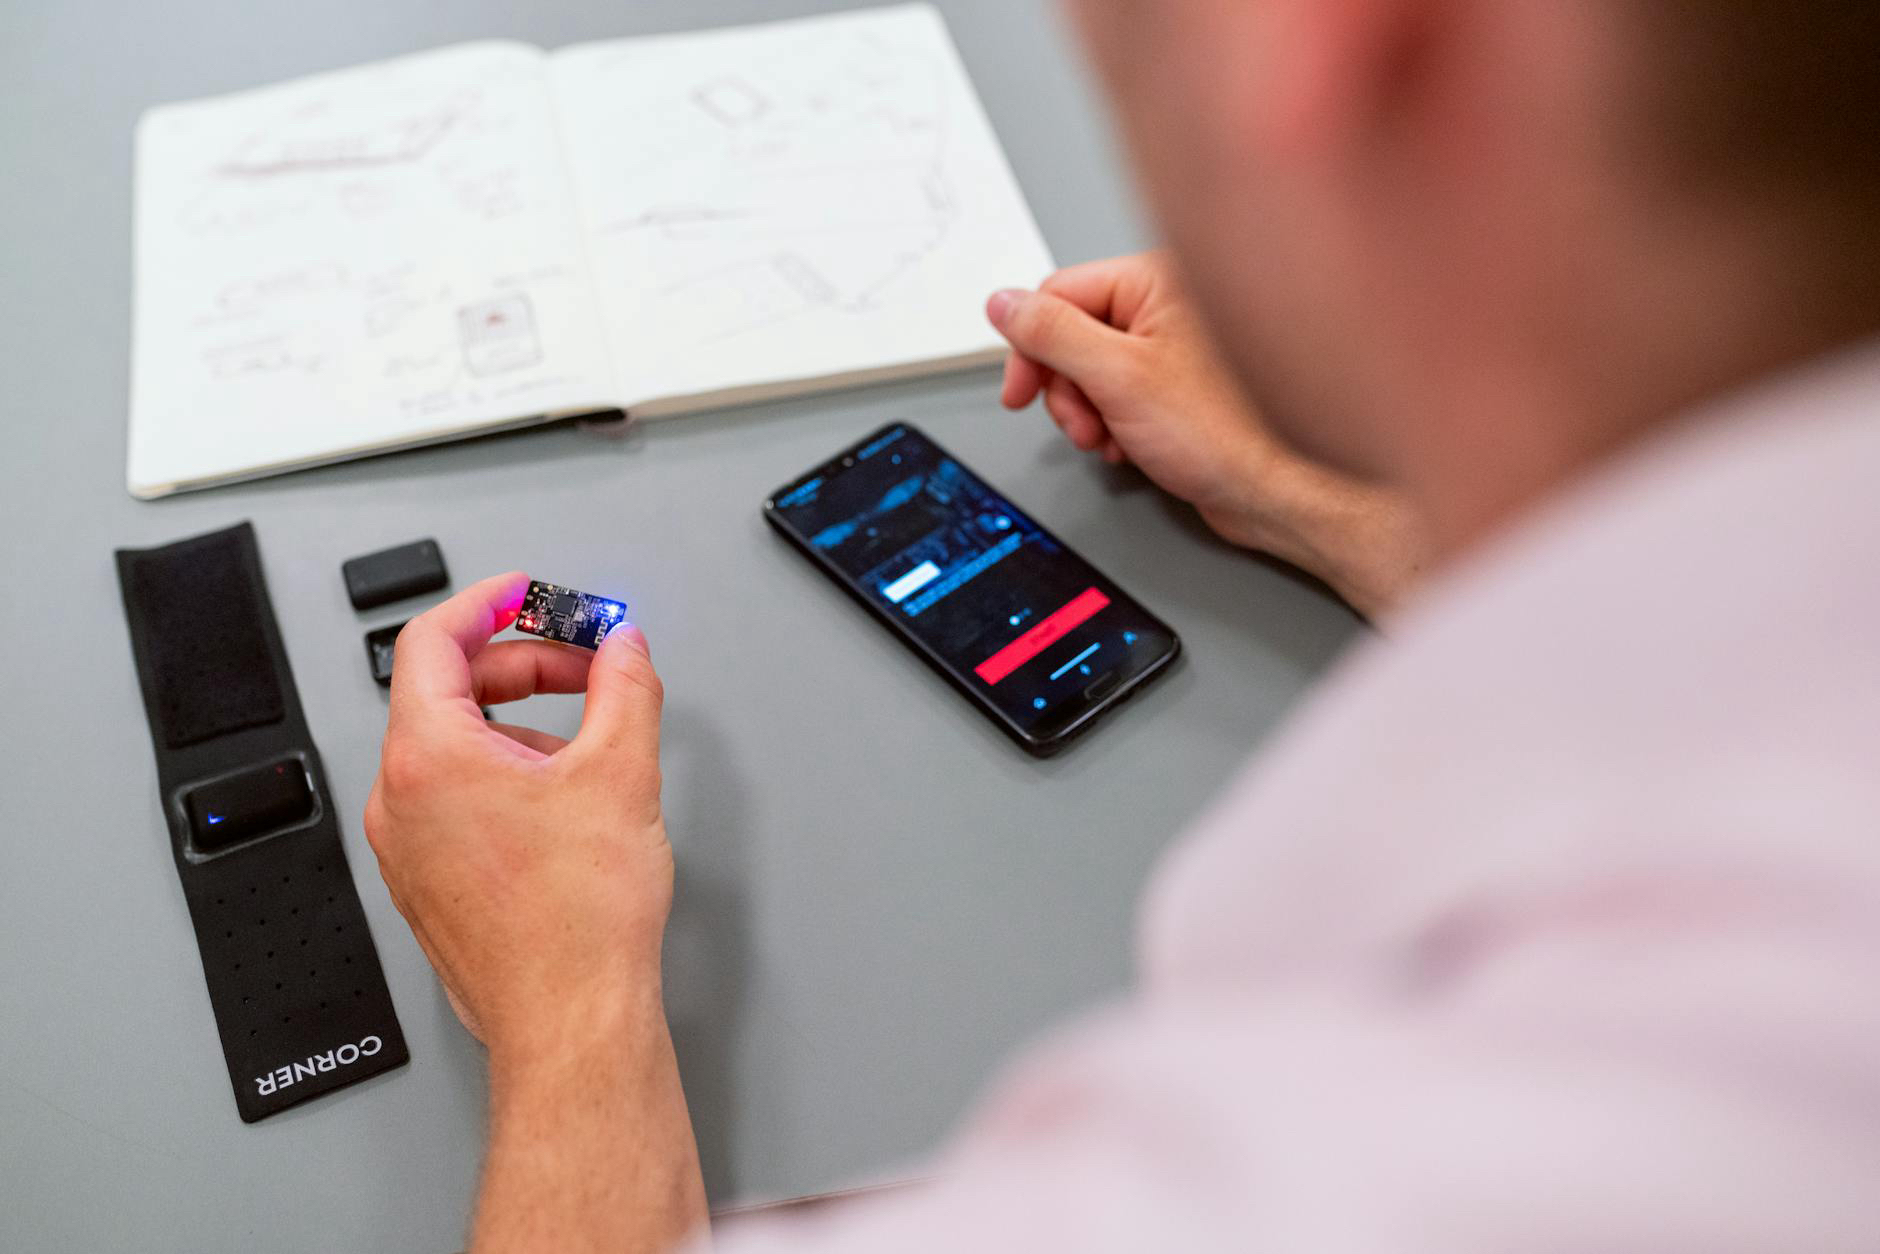
Modern data-driven design draws from a growing toolkit. The key isn’t just in choosing tools—it’s knowing what questions to ask.
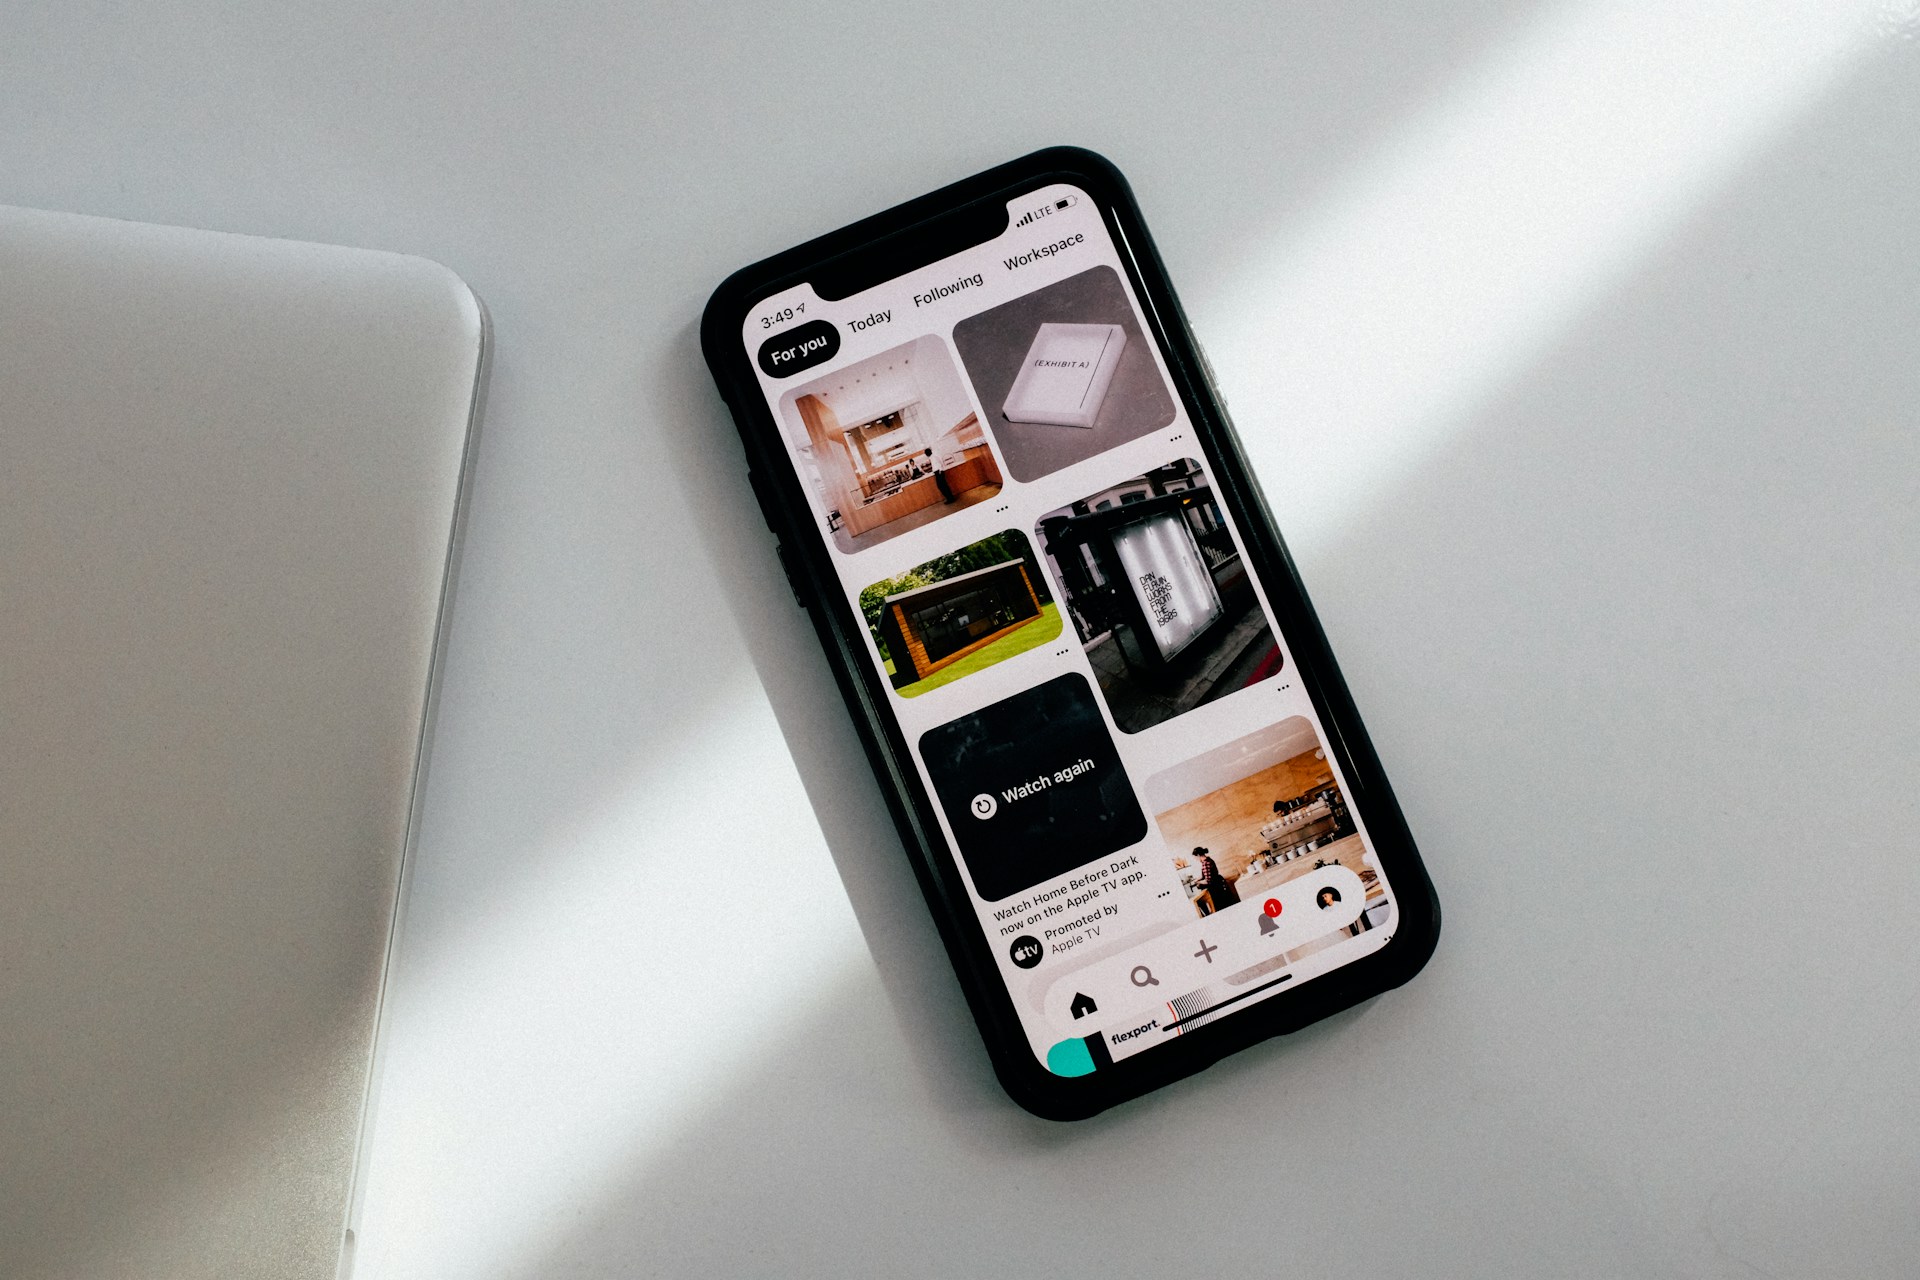
- User analytics platforms like GA4, Mixpanel, and Amplitude allow teams to track flows, understand drop-offs, and segment audiences based on actions and demographics. These platforms help answer foundational questions like: Where are users coming from? Where do they go next? At what point do they disengage?
- Session replay and heatmap tools such as Hotjar and Crazy Egg let you visualize how users interact with specific elements on the screen. You can watch where they click, how far they scroll, and where they hesitate—insight that helps identify both pain points and missed opportunities.
- A/B testing platforms like Optimizely and VWO empower teams to test variations in real-time. Whether it’s a button label or an entire layout, A/B testing shows which version better supports user goals.
- Survey and feedback tools like Typeform and Maze gather responses in the user’s context, rather than after the fact. This in-the-moment feedback captures reactions that are fresh and honest.
- UX research and synthesis platforms like Dovetail and Lookback help teams analyze user behavior over time and turn observations into actionable insights. They help shape personas, design principles, and research-backed roadmaps.
Each tool contributes to the full design loop—but it’s not the technology that makes the difference. It’s the clarity of the questions driving their use.
Personalization and Predictive Design
One of the most transformative uses of data in design is real-time personalization. Rather than presenting the same interface to every user, data lets teams shape experiences based on user behavior, location, preferences, and past interactions.
In e-commerce, this might mean recommending products based on previous purchases. In SaaS platforms, onboarding flows can shift depending on whether a user is new or returning. Content platforms can prioritize relevance—offering curated feeds that match personal interest and engagement history.
As personalization matures, predictive design takes shape. Systems begin to anticipate user needs before they are even expressed. This could be as simple as preloading frequently accessed content or as complex as adapting entire workflows based on usage patterns and performance over time.
While personalization is becoming expected, predictive design offers the next leap—design that feels not just responsive, but intuitive.
Guardrails: Ethics and Integrity
Designers working with data must also confront responsibility. With greater insight comes the need for greater care. It’s easy to fall into the trap of designing solely for optimization—tweaking metrics while losing sight of user well-being.
Ethical data-driven design considers more than outcomes. It asks tough questions:
Are we transparent about how we collect and use data? Are we designing for real inclusivity—or just the majority? Are we basing decisions on statistically sound information, or drawing flawed conclusions? Are our metrics serving users, or just internal goals?
Data can reveal how people behave, but it can’t replace human judgment about what’s appropriate or meaningful. Design teams must set clear ethical boundaries. They must center transparency, avoid manipulation, and advocate for experiences that empower—not exploit.
Where Creativity Meets Evidence
There’s a common concern that data might limit creativity. But in reality, data unlocks it. When insights guide design, teams can experiment more boldly—because they know how to evaluate outcomes. Ideas move from speculation to structured exploration.
Want to redesign a checkout flow? Use behavioral data to see where friction exists. Want to explore bolder typography or a minimalist layout? Test variations and compare the results.
This kind of evidence-based creativity doesn’t mean playing it safe. It means testing fast, learning fast, and building with purpose. It also means designers gain leverage in decision-making—armed not only with intuition, but proof.
When to Use Data-Driven Design
Not every project needs full instrumentation from the start. But certain signals indicate when a data-driven approach is especially powerful.
If you’re designing at scale, iterating on a live product, or dealing with multiple user types, data helps you segment and prioritize. If you’re refining existing systems, data helps uncover what to keep, what to evolve, and what to remove. And when internal teams disagree on the best path forward, data becomes a neutral anchor—grounding conversations in user behavior, not personal opinion.
The most effective design teams move seamlessly between insight and creativity, trusting each to inform the other.
Listen, Then Lead
Data-driven design begins with listening. Not to assumptions. Not to internal pressures. But to users—their actions, their feedback, their intent. Their friction is the map. Their momentum is the goal.
The data we gather is a reflection of experience. But the power lies in how we use it—to remove barriers, clarify paths, and make digital experiences more human.
At its best, data-driven design isn’t reactive. It’s visionary. It doesn’t just measure what works—it helps shape what’s next.
Our published articles are dedicated to the design and the language of design. VERSIONS®, focuses on elaborating and consolidating information about design as a discipline in various forms. With historical theories, modern tools and available data — we study, analyze, examine and iterate on visual communication language, with a goal to document and contribute to industry advancements and individual innovation. With the available information, you can conclude practical sequences of action that may inspire you to practice design disciplines in current digital and print ecosystems with version-focused methodologies that promote iterative innovations.
Related Articles –
-
The Most Common UX Errors in Enterprise Dashboards (And How to Fix Them)
-
Multivariate Testing: Optimizing UI Through Combinational Insight
-
Early Stage Prototyping in UI/UX Design
-
UX Design for AI Products: Merging Innovation with Usability
-

Elevating Web Design from Average to Exceptional
-

The Anatomy of UX Design
-

How to Best Perform Data-Driven UX Design
-

UX Design Metrics: Measuring Success and Driving Continuous Improvement
-

Statistical Inference in UX Research: Enhancing Usability Through Quantitative Analysis
-
Unlocking Design Potential with Data-Driven Design